Basic Skew-T Analysis: Snow Or No Snow?
It’s been a long time since we’ve posted some new content to the site, but in honor of Leap Day, let’s leap across the country to do some real basic Skew-T analysis in central California to check out the chance for snowfall later this morning.
Note first that elevation plays a huge role in the type of precipitation for the region we’re taking a look at today. The point that I had my Skew-Ts centered around is located at an elevation of approximately 2100 feet ASL. Go a few hundred feet up in elevation, and it’ll most certainly be cold enough for snow to fall, at least in the layer directly above the surface. Go down several hundred feet and snow is much less likely to occur. As we’ll soon see, there are some very interesting divergences in the models we’re looking at here.
What we’re going to be focusing on primarily in this post is reading part of the Skew-T Log-p diagram to determine (or at least take a stab at) precipitation type. The “Skew-T” diagram is one of the most useful, but rather intimidating tools in meteorology (it’s basically a super-convenient atmospheric calculator). To read more about the Skew-T diagram, click here! Now let’s start analyzing some weather!
All of the model soundings in the diagram are centered around the point linked to above and are for 15z, or 7AM PST.
| Skew-T Image | Discussion |
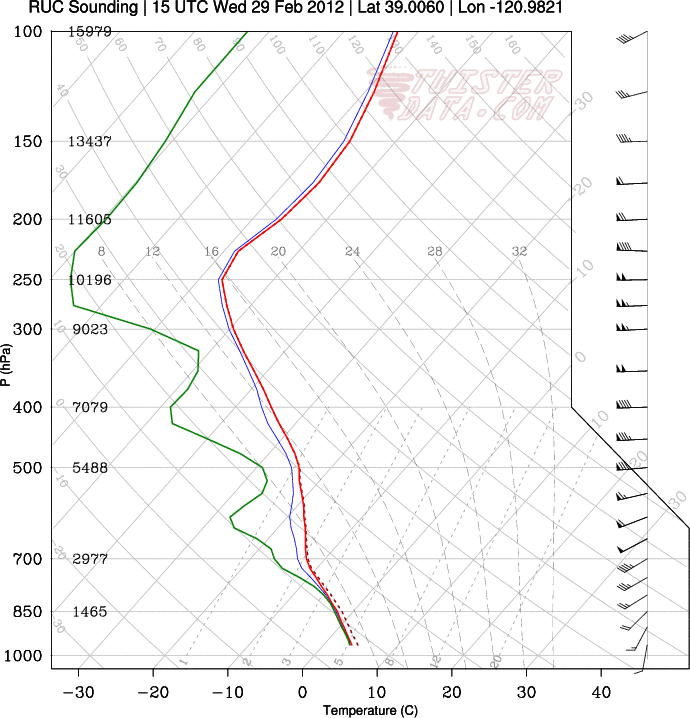 |
The RUC model is a higher-resolution model that runs every hour. What we see on this diagram from the 05z run is that the surface temperature is solidly above freezing (freezing being the line starting at 0°C on the bottom axis and moving diagonally up to the right). The temperature (and wet-bulb and dewpoint temperatures) all cut across the isotherms (lines of equal temperature) as height above the ground increases. This means the temperature cools off rather quickly as height increases. However, because the surface temperature is well above freezing and there is a fairly tall layer (from the surface to around the 875mb height) above freezing, I would say the most likely surface precipitation type based on this model would be rain. |
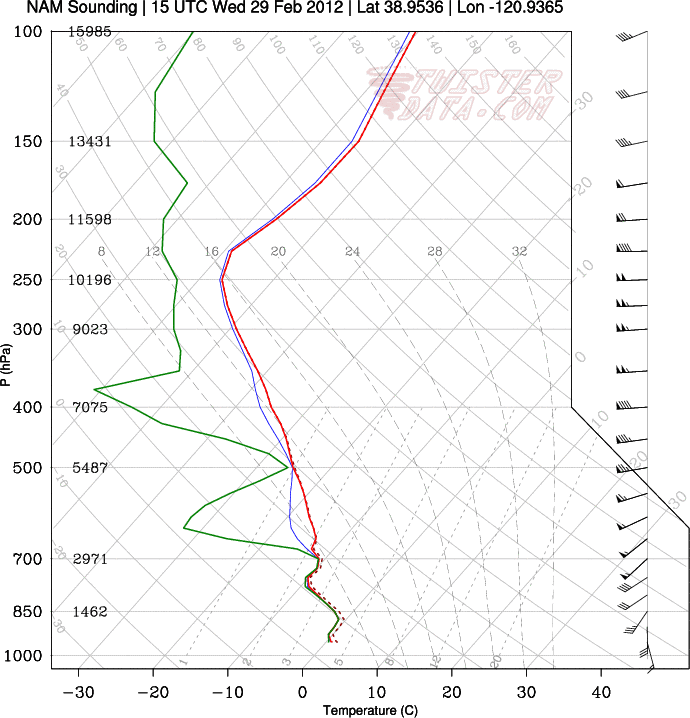 |
The NAM is a short-term forecast model which runs four times a day. This diagram was generated based on data from the 29 Feb 00z run. It is much more interesting in terms of precipitation type for several reasons. First, the surface temperature is almost spot on the freezing mark. The temperature profile is markedly different the first several hundred feet above the surface compared to the RUC output. While this model also is predicting precipitation at 15z, the temperature profile remains ever so slightly below freezing up to about the 860mb level or so (approximately 1300m above sea level) before decreasing much more rapidly with height. I would expect snow showers from a profile like this, and find this scenario to be somewhat believable. |
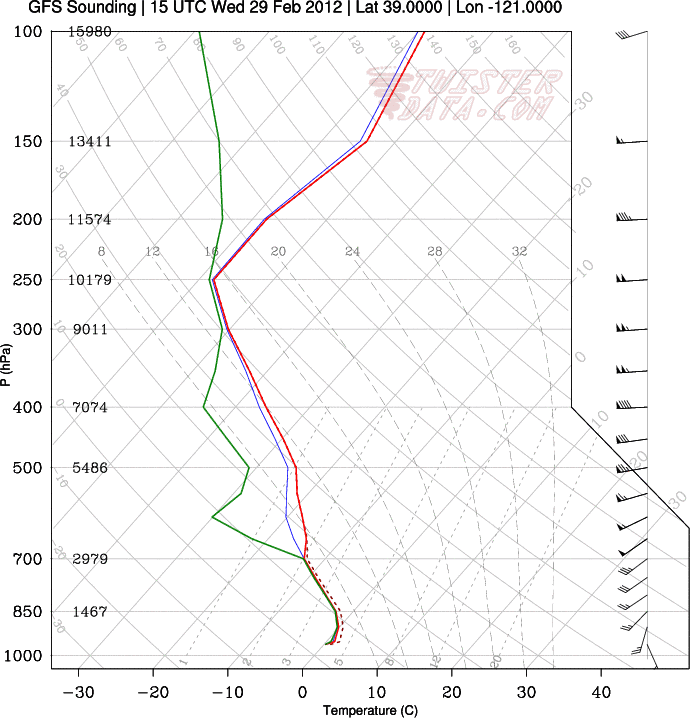 |
The final output displayed here is from the GFS model, which is a global forecast model which also runs four times a day. Unfortunately, the latest data I was able to access while writing this article was the 18z run, which is rather outdated (in the world of weather forecasting). On this diagram, the surface temperature is just above freezing, while there is a slight warm pocket noticeable immediately above the surface. This warmer pocket (an inversion, really) contributes to more interesting frozen precipitation types. In this case, because the “warm” layer is so shower, I would be inclined to say that this diagram is indicating mostly snow falling, with some pellets of sleet mixing in, possibly. |
The Skew-T diagram, no matter how useful, is only one tool in the forecaster’s toolbox. As you can see, different models can create very different scenarios for the same location at the same time. That’s part of the challenge of winter weather forecasting! If I were to make a prediction for this setup (difficult considering I am rather unfamiliar with the area), I would go with snow as the most likely precipitation type. It may mix with some rain showers (and possibly sleet, though I find that to be more unlikely). It’s important to note that the Skew-T diagram is by no means likely the easiest, nor the best, way to get a snowfall accumulation prediction. Here, we’re simply examining the profiles to get a sense of what sort of precipitation type is most likely. Perhaps we will tackle the accumulation problem in another blog post. Hopefully for now, you have gained some new appreciation as to one of the most powerful tools in meteorology – the Skew-T log-p diagram!
Thanks to Andy M. for providing today’s question!